US Tornadoes 1950-2019: A look at what the data may be telling us
A few years back, I was teaching Python to a group of high school students and they wanted to use their newly developed skills with the Matplotlib package to see if climate change was contributing to more frequent and stronger tornadoes. We found the National Weather Service database that contained a single CSV file of all tornadoes from 1950 through 2017. The database now goes through the end of 2019. Each line of the CSV file contains information for a single recorded tornado, 66,388 in total. Among the information is the date and time, the location, magnitude, injury and fatality count, and property loss amounts for the given tornado.
We chose to plot every single tornado on a US Map (excluding Alaska and Hawaii due to very low counts, 4 and 41, respectively) as a function of the Extended Fujita Scale magnitude contained in the database. This is shown in the first figure below.
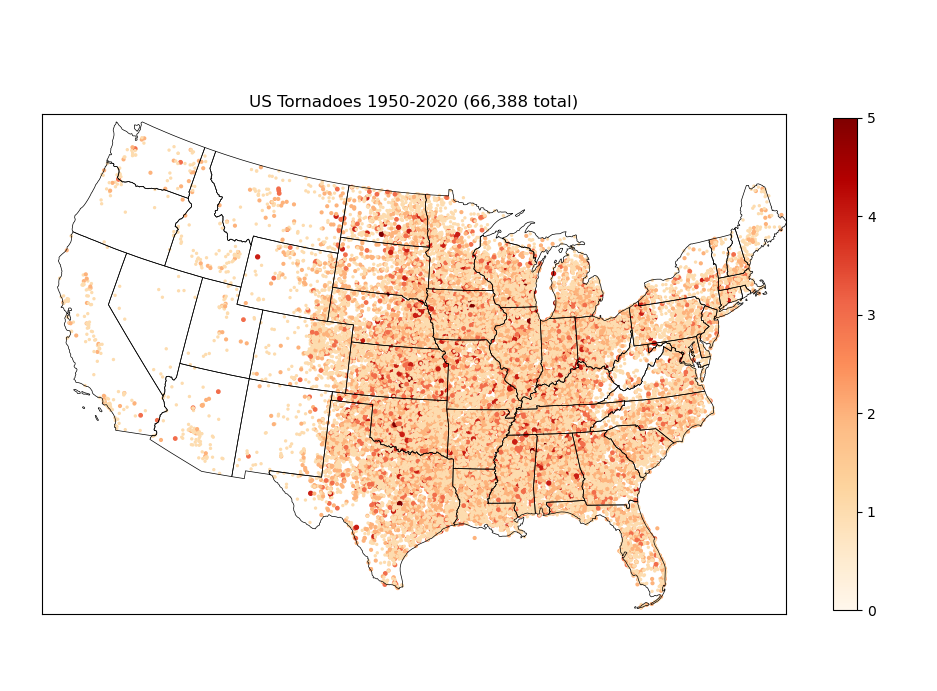
A question that occurred to us immediately was just how concentrated the tornadoes are almost immediately east of the Rocky Mountain range, which in the US runs from the border of Canada in Montana through central New Mexico. That was left for further exploration.
Another plot we generated was a bar plot showing the total number of tornadoes of each category strength, by decade. The purpose of this was to help us figure out if if climate change was contributing to an increased number in any category. This is shown in the next figure.
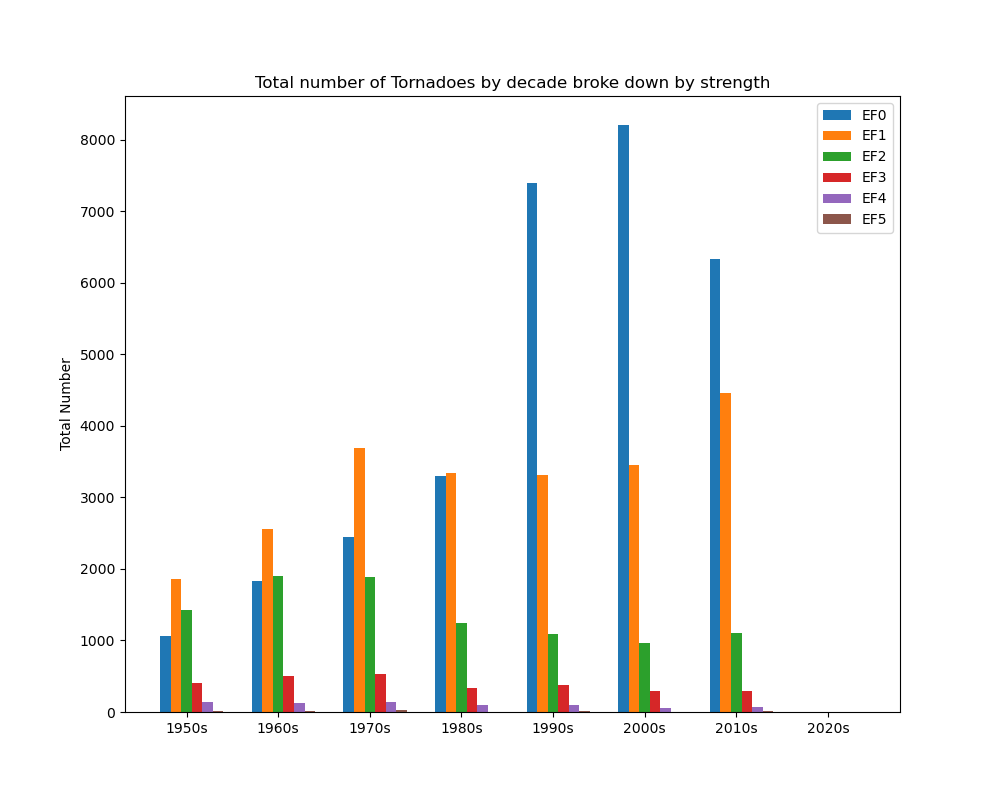
It isn’t obvious to us and a real determination would have to draw upon the National Weather Service’s other database of severe weather and reports to see an overall picture of what might be going on. What we see in this data is the following. Most notably, starting in the 1990s there is a drastic increase in the number of EF0 tornadoes. A reason for this, when reading through the white paper describing the data, is that prior to 1982 0-magnitude values were estimated using property destruction data and other less scientifically defined metrics. The values in the dataset prior to that time have therefore been fit to a modern EF value by methods described in the paper. That means that all newer data is more trustworthy, in a sense. So take the drastic increase with that in mind. The second thing that sticks out is that there isn’t a significant increase from 1980 onwards in any other category, with maybe the exception of category EF1 tornadoes in the 2010s.
As stated before, this doesn’t quite give us the picture that tornadoes are increasing in strength or frequency but we also haven’t looked at other possible patterns. The NWS has mentioned in its own reports on climate change that tornadoes may not be increasing in overall numbers but their clustering behavior has changed significantly. They see this when combining tornado data with severe storm data, and look not just at the number of tornadoes in a year, but at the number of tornadoes that may spawn within a given day or weekly window timeframe. And this brings us to today. The students stopped working on this with the previous two figures as they moved on to other material.
A recent suite of powerful storms spawned tornadoes in Arkansas, Illinois, Indiana, Kentucky, Mississippi, Missouri, Ohio and Tennessee on Friday and through the weekend of December 10, 2021. This is part of the new emerging pattern that climate researchers are seeing. It is also notable for being late in the year – December. Many have mentioned these out-of-season tornadoes as a sign of climate change. That led me to wonder, just what is the tornado season (in the USA)? Growing up in Missouri, the midwest, we understood this to be roughly April through August, but has this always been the case? That is the purpose of the next two figures.
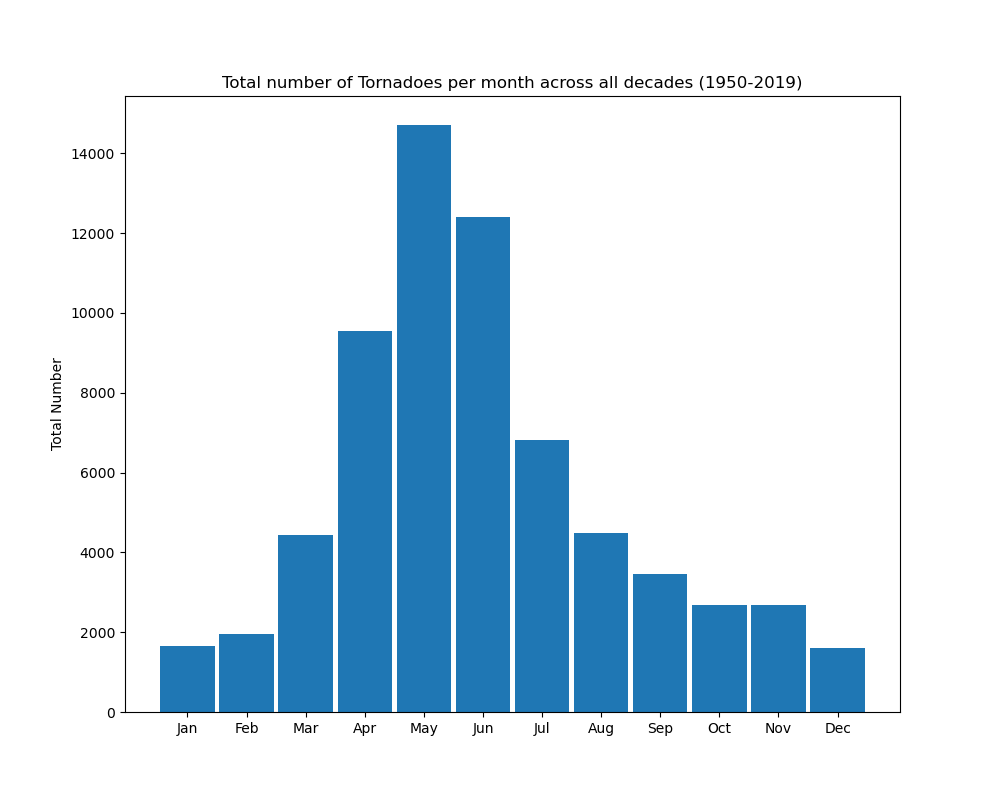
The figure below is a simple bar graph tallying all tornadoes by month from 1950-2019. It depicts a bell graph-like shape with a majority of tornadoes falling between April and July, more or less what we tend to think of as tornado season. But it also shows that tornadoes in late winter months such as December and January are not as uncommon as we think.
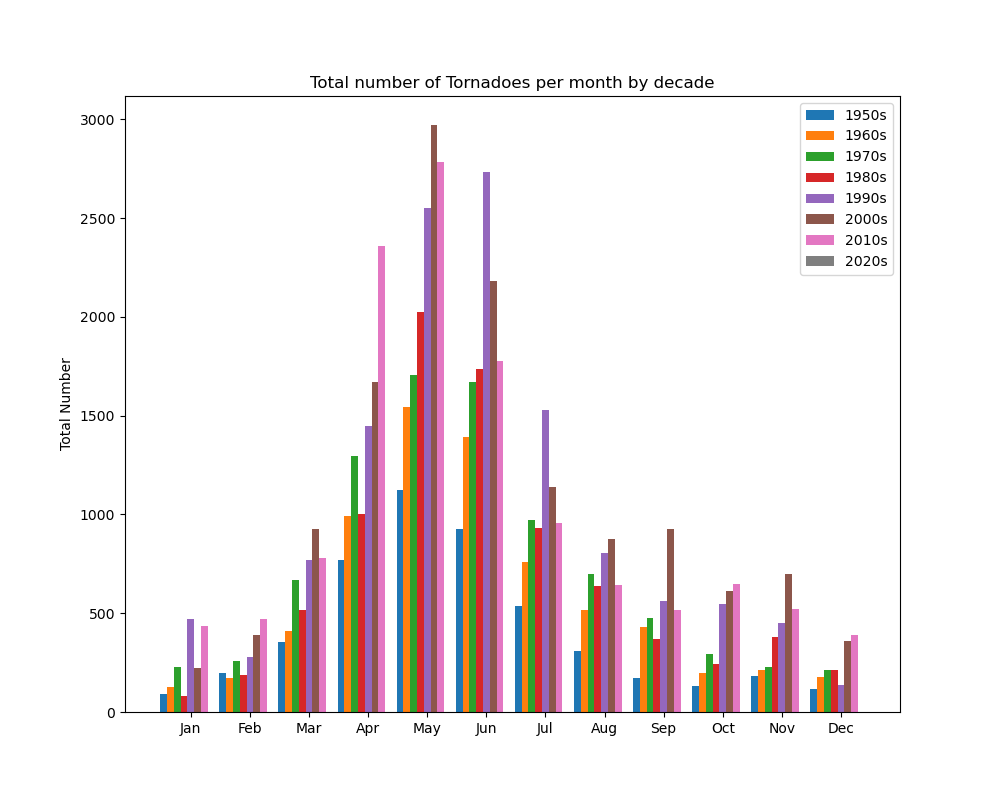
The next figure is a similar plot by month but shows a count by decade for each month. The idea is to see, for example, if there is a general increase in tornado counts for any given month. There does seem to be a dramatic increase in the last three decades but we would also have to take into account the 1982 shift mentioned above. Also, a cluster analysis still needs to be done to find examples of increased clusters of tornadoes, and this is left for future work.


Recent Comments